Key Takeaways
-
Amazon shares remain in the spotlight as the e-commerce giant’s annual Prime Day gets underway this week and the Trump administration indicated it would continue to delay tariffs.
-
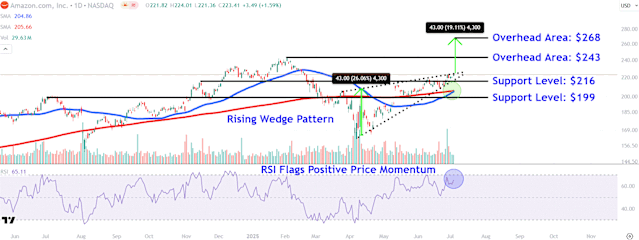
After setting its April low, the stock has trended higher in an orderly rising wedge, with the price recently threatening to break out above the pattern’s upper trendline.
-
Investors should watch crucial overhead areas on Amazon's chart near $243 and $268, while also monitoring major support levels near $216 and $199.
Amazon (AMZN) shares remain in the spotlight as the e-commerce giant’s annual Prime Day gets underway this week and The Trump administration over the weekend indicated that its most extreme 'reciprocal' tariffs would not go into effect this week.
Investors will be tracking how the stock performs during this year’s Prime Day event, which starts Tuesday and has been extended from two days to four after sales at last year’s event hit a record. Meanwhile, the company’s shares could receive a boost after President Donald Trump confirmed that many countries will have until Aug. 1 to continue trade deal negotiations.
Amazon shares gained 13% in the second quarter, but trade just 2% higher since the start of the year as of Thursday’s close amid concerns that higher prices driven by tariffs could dent the company’s sales.
Below, we analyze the technicals on Amazon’s chart and identify crucial price levels worth watching out for.
Rising Wedge in Play
After setting their April low, Amazon shares have trended higher in an orderly rising wedge, with the price recently threatening to break out above the pattern’s upper trendline. While this formation typically indicates a potential breakdown, it can also signal a move higher upon a bullish breakout.
In another win for the bulls, the 50-day moving average (MA) sits ready to cross the 200-day MA this week to generate a golden cross pattern. Meanwhile, the relative strength index (RSI) confirms positive price momentum, but remains below overbought levels, providing the stock with ample room for further upside.
Let’s identify two crucial overhead areas on Amazon’s chart that could attract interest and also locate several major support levels worth monitoring during possible retracements.
Crucial Overhead Areas to Watch
The first overhead area to watch sits around $243. This location on the chart could provide resistance near the stock’s record high set in February this year.
If the shares move into price discovery, investors can project an upside target by using the measured move technique, also known by chart watchers as the measuring principle. When applying this technique to Amazon’s chart, we calculate the distance of the rising wedge near its widest point and add that amount to the pattern’s upper trendline. The analysis projects a target of $268 ($43 + $225).
Story ContinuesMajor Support Levels Worth Monitoring
An initial pullback in the stock could lead to a retest of major support at $216. The price may attract buying interest around this level, near a trendline that connects a range of corresponding trading activity on the chart between November and June.
Finally, a more significant drop opens the door for selling down to the $199 level. Investors may look to accumulate Amazon shares at this price near several peaks and troughs on the chart stretching back to last July’s prominent swing high.
The comments, opinions, and analyses expressed on Investopedia are for informational purposes only. Read our warranty and liability disclaimer for more info.
As of the date this article was written, the author does not own any of the above securities.
Read the original article on Investopedia


